The Vibe Code Spot
Vibe Coding Project Directory
SEO Insights Dashboard - Professional Search Console Analysis
Analyze your Google Search Console data with advanced SEO insights. Discover keyword opportunities, optimize CTR, and boost organic traffic with detailed reports.
How the SEO Insights Google Search Console dashboard tool helps you find SEO opportunities fast
Upload your Google Search Console Queries CSV (must include columns: Top queries, Clicks, Impressions, CTR, Position) and get clear, prioritized SEO tasks without wrestling with spreadsheets. The tool parses your GSC data and turns it into actionable insights: overall performance metrics, position distribution, keyword opportunity lists, CTR targets, visualizations, and ready-to-use recommendations.
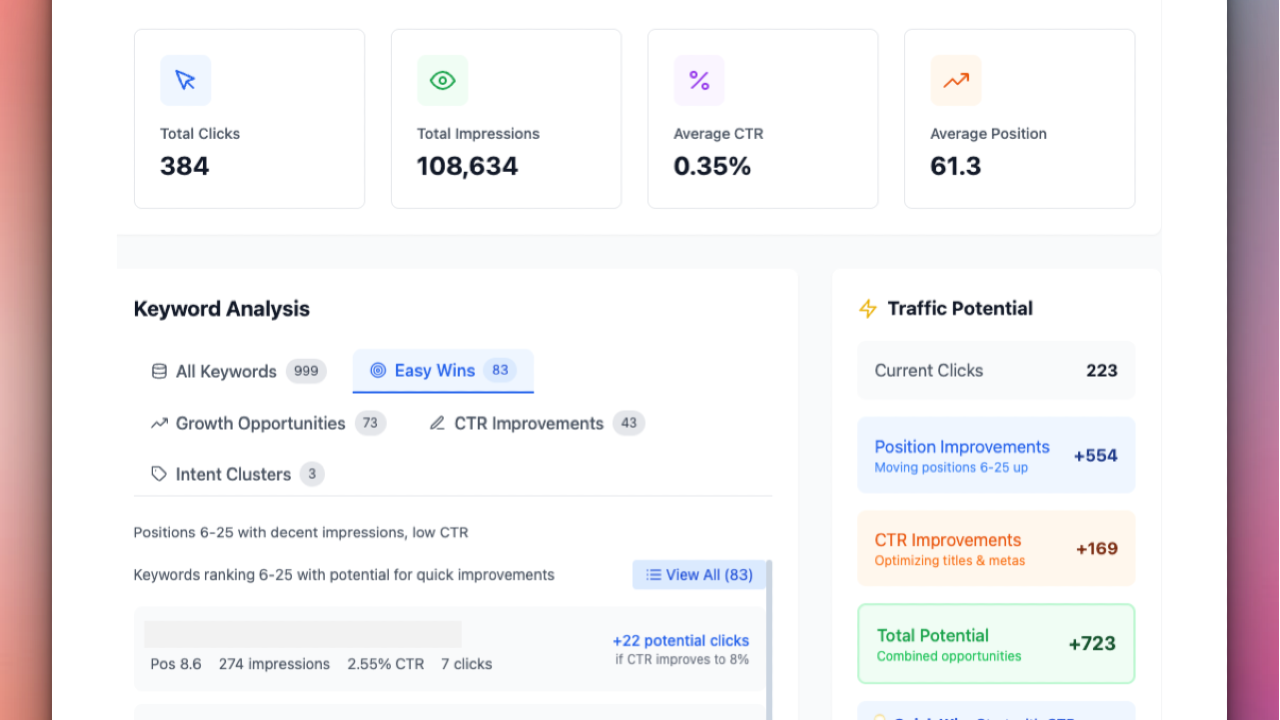
You'll quickly see total clicks, impressions, and overall CTR, plus an average position overview so you know how close pages are to higher-traffic ranks. The tool highlights "easy wins" — queries ranking around positions 8–20 that usually respond well to on-page changes or internal linking — and flags high-impression queries with unusually low CTR that can benefit from better titles, meta descriptions, or structured data.
Visual charts (CTR vs position scatter plots, distribution charts) make it easy to spot underperforming queries. Keywords are clustered by likely intent (informational, transactional, navigational) so you can prioritize fixes that match user intent. Exportable CSV and PDF reports let you share findings with clients or teammates.
What the tool does — at a glance
Parses your Google Search Console Queries CSV and validates required columns. Calculates totals: clicks, impressions, and overall CTR. Computes average position and shows position distribution (positions 1–3, 4–10, 11–20, etc.). Identifies easy-win keywords (typically position 8–20 with meaningful impressions). Surfaces growth opportunities (high impressions, low CTR or position just outside top 10). Estimates incremental clicks if CTR improves to expected benchmarks for a given position. Produces CTR vs position scatter plots and performance distribution charts. Clusters keywords by intent (informational, transactional, navigational). Generates actionable SEO recommendations and traffic potential estimates. Exports results to CSV or PDF for reporting. Why this matters Move-the-needle improvements: Raising rankings from the mid-teens into the top 3 often multiplies clicks because CTR is heavily concentrated in the top positions. Quick wins without heavy lift: Small on-page edits, meta updates, or internal links can turn mid-ranking queries into significant traffic sources. Data-driven prioritization: Focus time on queries that have both visibility (impressions) and room to grow (position/CTR). Better reporting: Exportable summaries and visualizations save time preparing client or stakeholder updates. Key features explained Performance summary Get totals (clicks, impressions, CTR) and average position to understand overall search health and how close pages are to higher-visibility results.
Easy-win keywords (positions 8–20) These are the low-effort, high-reward targets. The tool ranks them by impressions and estimated click gains to help you prioritize which pages to update first.
Growth opportunities (high impressions + low CTR) Queries that already get impressions but have low CTR are ideal for title/meta edits, schema, or improved snippet optimization. The tool estimates potential additional clicks if CTR reaches expected levels for the given position.
CTR vs position analysis A scatter plot shows each query’s CTR against its average position. This helps spot queries that underperform relative to others at similar positions — prime candidates for snippet optimization.
Intent clustering Keywords are grouped into informational, transactional, and navigational categories. That steers your fixes: informational pages may need better content depth; transactional pages often benefit from clearer CTAs and schema.
Actionable recommendations For each prioritized query you get specific suggestions: title/meta improvements, content additions (FAQs, comparison sections), structured data suggestions (how-to, product, FAQ), and internal-linking ideas.
Traffic potential and reporting For top opportunities, the tool provides estimated incremental clicks and a suggested timeline to test changes. Export CSV for further analysis or PDF for stakeholder-ready summaries.
Step-by-step use guide Export your Search Console Queries CSV (ensure columns: Top queries, Clicks, Impressions, CTR, Position). Upload the CSV to the tool. Review the Performance Summary for a quick snapshot. Open the Easy Wins report and sort by impressions and potential clicks. Use the CTR vs Position scatter plot to find low-CTR pages that need better snippets. Check Intent Clustering to align fixes with user intent. Apply recommended changes: title/meta edits, content updates, schema, internal linking. Re-export Search Console after 4–8 weeks to measure impact and iterate. Example outputs you’ll receive Query: "best travel backpack" — Position 12, Impressions 9,400, CTR 1.1% Recommendation: Rewrite title to include "2025 best travel backpack — buyer's guide", add a comparison table and product reviews, add internal links from related listicles. Estimated monthly clicks gain: +1,200 (if position moves into top 5 and CTR improves).
Query: "how to fix sagging couch" — Position 5, Impressions 3,000, CTR 2.6% Recommendation: Add a step-by-step how-to section with H2s, include a short video or image steps, add FAQ snippet and HowTo structured data. Estimated CTR lift to 6% -> +600 monthly clicks.
Who benefits most from this custom Google Search Console Dashboard
SEO specialists who want fast, prioritized actions without manual spreadsheet work. Content marketers aiming to turn visibility into traffic with targeted updates. Agencies and consultants creating client deliverables and optimization roadmaps. Site owners who want clear, measurable steps to improve organic performance. Limitations and best practices Use a recent, relevant date range for your CSV export (e.g., last 3 months) to find actionable trends. Position and CTR are averages and can fluctuate; treat estimates as guidance for prioritization, not exact forecasts. Implement changes and measure results over several weeks; ranking improvements often take time and multiple iterations. Combine these insights with page-level analytics (engagement, conversions) to prioritize high-value pages.
Next steps
Upload your Google Search Console Queries CSV (Top queries, Clicks, Impressions, CTR, Position) to get a prioritized list of easy wins, CTR improvement targets, visual reports, and exportable recommendations